Economist’s Corner: What’s Holding Back New Jersey’s Labor Supply?
Economists love their data, and for good reason. Data enables us to understand important issues such as what factors support economic growth, impact price inflation, and alter labor flows. Right now, many people are struggling to use data to answer one very important question: is overgenerous government support for unemployed workers hindering businesses from recruiting the employees they need to recover from the COVID-19 pandemic? Today’s Economist’s Corner examines what the data has to say about this, and shows why this common, seemingly-intuitive explanation for why businesses are struggling to recruit workers likely doesn’t tell the real story.
There is a persistent narrative that unemployment insurance benefits are too generous, which is lowering the incentive of people to seek employment. At first glance, this could make intuitive sense. Currently, we are seeing a surge in job openings, most notably for jobs requiring relatively low levels of education. But at the same time small businesses are having an historically hard time filing open positions. Normally, with such high unemployment, small businesses would be having a relatively easy time finding willing workers. After all, a high unemployment rate means there is a considerably higher supply of people willing to work then there is demand for those workers. Thus, the evidence would seem to suggest the need to reduce unemployment insurance in order to get people back to work.
However, this simple explanation misses a few key pieces of data. This article addresses the problems with this narrative and suggests some alternative explanations that better fit the data and offer reasons for optimism, but before we can get into that, we need to get on the same page regarding the data that we’ll be examining.
The main way macroeconomists measure economic growth is GDP, which measures the income generated by the mix of land, labor, capital, materials, and technological progress. As for the labor markets, there are many ways to measure it. Probably most often used is the unemployment rate, which estimates the share of people in the labor market looking for a job but currently without one.
Macroeconomists also use data to examine the relationships between concepts, such as how economic growth impacts inflation and supply and demand for workers. One of the key relationships is that between economic growth and the state of the labor market. The idea that there should be a relationship between economic growth and the labor market is easy to understand – labor is a key input to economic production, so as pressure grows on the economy to expand, demand for labor should increase.
One of the best ways we have to examine this relationship is comparing the unemployment rate to what is known as the GDP gap, which estimates the difference between where GDP is and where it could be if it were running at its full potential. Think of it this way – imagine a factory running at 70% of its capacity. It has enough unused machine time to produce 30% more than what it is actually doing without having to hire more people or invest in more machinery, which is a gap between actual and potential output. Just apply that concept to the economy and you have a basic understanding of the GDP gap.
Furthermore, it makes sense that this gap would be related to the unemployment rate – an unemployment rate is, essentially, a gap in labor utilization. If the unemployment rate is at 10 percent, it means 10 percent of people who would like to be employed are not – that’s a gap. And a gap in the economy should be reflected in a gap in labor supply versus demand.
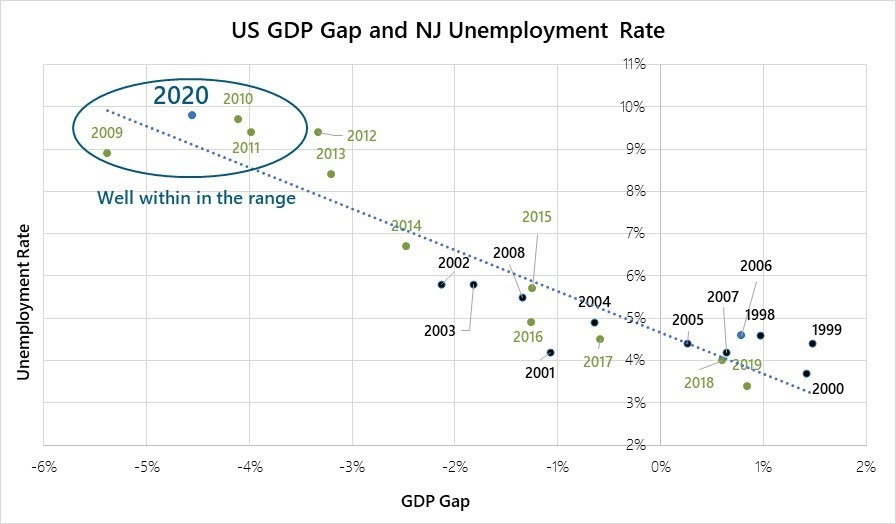
The following chart shows the relationship between the unemployment rate and the US GDP gap for New Jersey. On the chart, the unemployment rate is tracked on the y-axis and the GDP gap is tracked on the x-axis (the bottom axis). The chart shows two main things. For one, every point indicates where the unemployment rate and GDP gap were for that year. For example, in 2011, the NJ unemployment rate was 9.4 percent and the US GDP gap was -4.0 percent. The chart shows another thing – the relationship between the unemployment rate and the GDP gap. A larger (more negative) gap is associated with a higher unemployment rate. The dotted line shows the line that is the best fit for all the points. As can be seen, the data for 2020 was very close to what would be expected given the linear model fit. In sum, there is nothing strange about the 2020 level of the unemployment rate given the level of the GDP gap.

Now you might be thinking, “OK, that’s great mister economist, the unemployment rate is in line with where the GDP gap says it should be, but why are you telling me all of this?” Well, there is a reason, and it has to do with unemployment insurance.
Contrary to the argument that unemployment insurance is keeping people from taking available jobs, this chart suggests unemployment insurance is not the driving factor keeping people out of jobs. When a person is collecting unemployment insurance, that person should be officially classified as unemployed. Thus, if there were an extraordinary amount of people who were choosing to remain unemployed because of the incentive to do so, the unemployment rate would be considerably higher than what you would expect given the GDP gap. And that is not the case – the unemployment rate is right where it should be. Thus, there is no good evidence to suggest that unemployment insurance is incentivizing people to remain unemployed.
Ok, so unemployment insurance isn’t the problem. Then what is? Evidence suggests there are other disincentives aside from unemployment insurance keeping people from taking available jobs right now. Two immediately come to mind:
- A lack of child care remains an intractable issue.
- We are still in a pandemic.
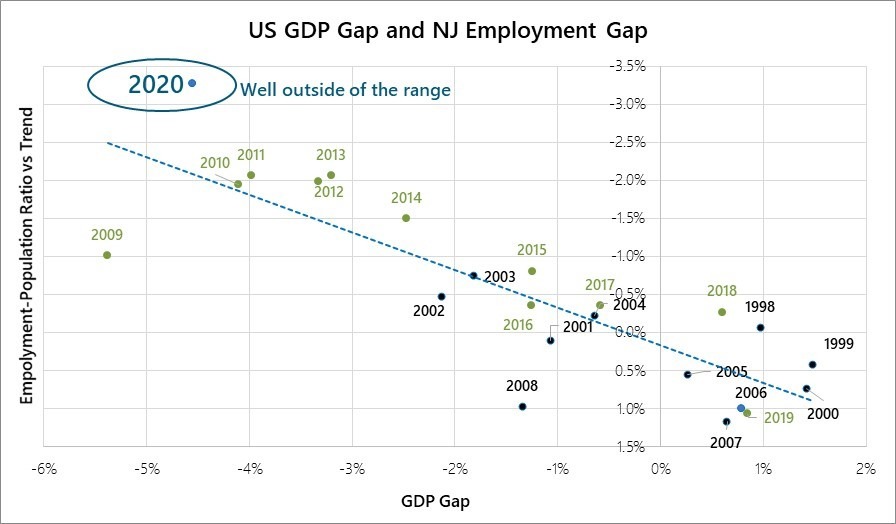
To start examining these issues, it is worthwhile to look at a measure of the labor market gap that is more comprehensive than just unemployment, because one thing the unemployment rate does not capture is people who are not employed and not actively looking for employment. These are people who are out of the labor market, and as it turns out there has been a huge surge of people in 2020 who left the labor market. To capture this dynamic, a better measure of the labor market gap is the difference in employment-to-population ratio versus its trend. Employment-to-population is the share of the adult population that is employed. If a person leaves New Jersey’s labor market but remains a resident of New Jersey, that person is still counted in the denominator – population – so it better reflects all changes in labor market supply and demand. This labor market gap measure is depicted in the chart below relative to the GDP Gap.

As the chart shows, this measure of the labor market gap is beyond what would be expected given the GDP gap. Thus, there is evidence to suggest more people left the labor market in 2020 than would be expected.
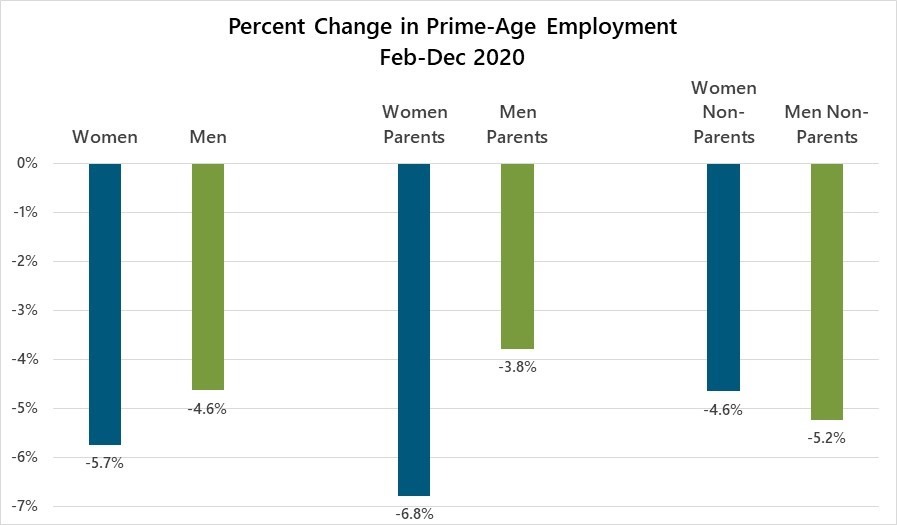
So, why would so many people have chosen to outright leave the labor market? A conceivable driver is that a lack of child care is holding people – especially women – back from reentering the labor market. The following chart was produced for our previous issue of the Economist’s Corner. It shows prime-age women’s employment has dropped considerably more that of men.
Further delving into the data shows that the intersection of gender and parenthood is where the dichotomy occurs. Female parent employment fell 6.8 percent through December, 2020, which is a much larger decline than the 3.8 percent drop recorded for male parent employment. The evidence suggests that this dichotomy results from female parents shouldering a larger share of child care responsibility than male parents. Thus, when child care, including education, essentially shut down, so did female parent labor market participation.

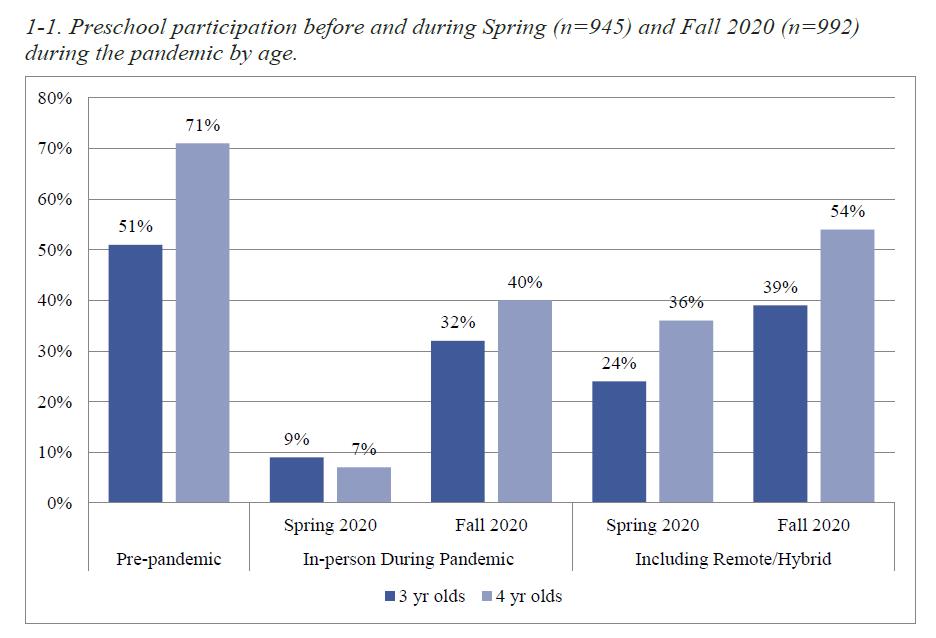
This next chart is a reproduction from a recent National Institute of Early Education Research publication showing preschool participation rates before the pandemic, in spring 2020, and in fall 2020. Whereas 71 percent of four-year-old children were enrolled in preschool pre-pandemic, that share plummeted to 7 percent in spring and recovered somewhat to 40 percent by fall. Drops of similar magnitude were reported for three-year-old children.
Applying absolute numbers to those percentage changes, as of 2018 there were 4.4 million three- and four-year-old children enrolled in preschool. A drop of 30 percentage points in enrollment share of population would mean approximately 1.8 million fewer three- and four-year-old children enrolled. Apply New Jersey’s share of the US population to those numbers, and we have approximately 55,000 fewer New Jersey three- and four-year-old children enrolled in preschool. If each of those children at home yielded a mother out of the labor force, that alone could account for 1/3 of the drop in New Jersey’s participation rate. And that’s not even considering other child care and educational sources for other age children.
The bottom line – child care has likely been a big reason why labor supply is so slow to recover, even as demand for workers is surging.

In addition to child care keeping parents, and especially mothers and other female caregivers, out of the labor force, labor force participation is also certainly down due to the simple fact that we remain in the midst of a deadly pandemic. At this point, approximately 51 percent of New Jersey’s population has received one or two vaccine doses, but that is not near the threshold necessary for herd immunity and many people are understandably hesitant to return to work in this context, especially in jobs that require in-person interaction.
Taken together, this evidence suggests that, even with no change to unemployment insurance, as more people receive vaccines and schools and daycares reopen to full capacity, it will become easier for businesses to fill open positions. However, there remains the underlying risk that structural damage has occurred in the child care industry with child care centers and home-based businesses closing due to the pandemic, lowering the supply of child care.
It is encouraging that help is on the way via a mix of organic economic growth, continued monetary stimulus, and a new fiscal package aimed at providing support to both working and unemployed mothers. The State has undertaken a number of initiatives to support the child care sector and families in need of child care assistance in this critical moment, including increased investments in child care, waiving parent co-pays in the State’s child care subsidy program, offering grants to child care providers, and providing tuition support for school-aged supervision. For its part, the NJEDA currently has $20 million in grants to provide to small child care businesses (with fewer than 50 full-time equivalent employees). Furthermore, the federal government’s American Rescue Plan will provide New Jersey approximately $267 million in child care assistance to parents and caregivers and approximately $428 million in funds to child care providers. Thus, a substantial amount of resources is being focused on supporting the child care industry. But until these issues are remedied, it is likely businesses will continue finding it hard to recruit the labor they so sorely need.
Related Content
April 15, 2024
NJEDA Establishes New Jersey Green Bank to Advance Climate Goals
TRENTON, N.J. (April 15, 2024) – Last week, the New Jersey Economic Development Authority (NJEDA) Board approved the creation of the New Jersey Green Bank (NJGB), which will make investments in the clean energy sector that will help advance the state’s efforts to make an equitable transition to 100 percent clean energy.
April 12, 2024
NJEDA Board Approves Anchor Tenants for Maternal and Infant Health Innovation Center
TRENTON, N.J. (April 12, 2024) – The New Jersey Economic Development Authority (NJEDA) Board on Wednesday approved three anchor tenants to lead the Maternal and Infant Health Innovation Center (MIHIC) in Trenton.
April 11, 2024
NJEDA Approves Creation of $7M Green Workforce Training Grant Challenge
TRENTON, N.J. (April 11, 2024) – The New Jersey Economic Development Authority (NJEDA) Board approved the creation of the Green Workforce Training Grant Challenge.


