Economist’s Corner – July 2021
The Economic Recovery Remains Incomplete
If you spend some time reading the popular press on the state of the economy, you’ll likely come away with a simple story: the economy is booming as everything re-opens and pent-up demand from the past year gets filled, but constraining economic growth are shortages of goods and labor, which is causing prices to spike. Thus, the economy is running too hot for supply to keep up, and the Federal Reserve needs to raise interest rates to slow the economy and the rate of inflation.
Oh, if it were all so easy. In this story, it’s all about supply not being able to keep up with demand, so we just need some recalibration. The ongoing strength of demand is given.
The full story is, like usual, much more complex. This economic recovery is far from complete, and if policy makers do not continue to focus on supporting demand, the rebound could falter at a time when labor demand remains uneven. Policymakers in New Jersey understand this, which is why we continue to roll out programs that focus funds and other supports to areas of the economy still in need, such as the Main Street Recovery Finance Program, which is launching later this year.
To see how the economic recovery remains incomplete, it’s important to understand that a principle reason the economy is currently booming is an unprecedented and ephemeral surge in fiscal stimulus to households. Once this fiscal stimulus and its effects start to wane, the economy will slow markedly.
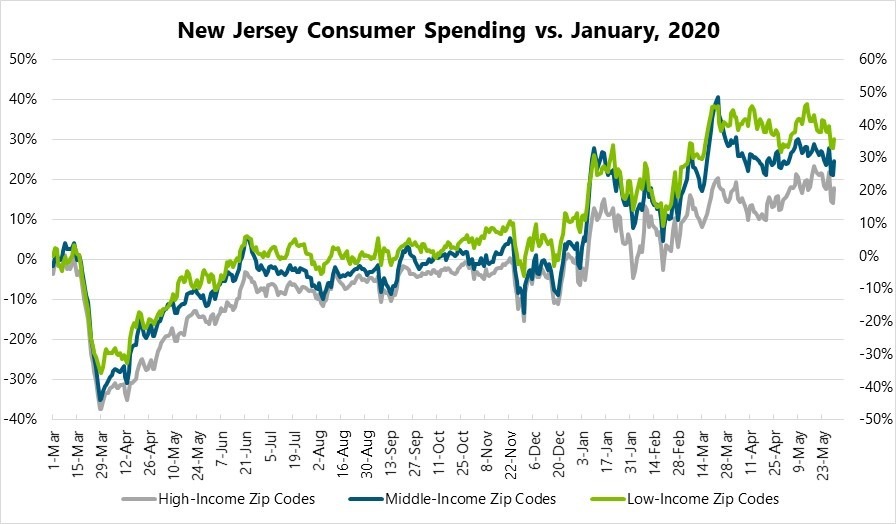
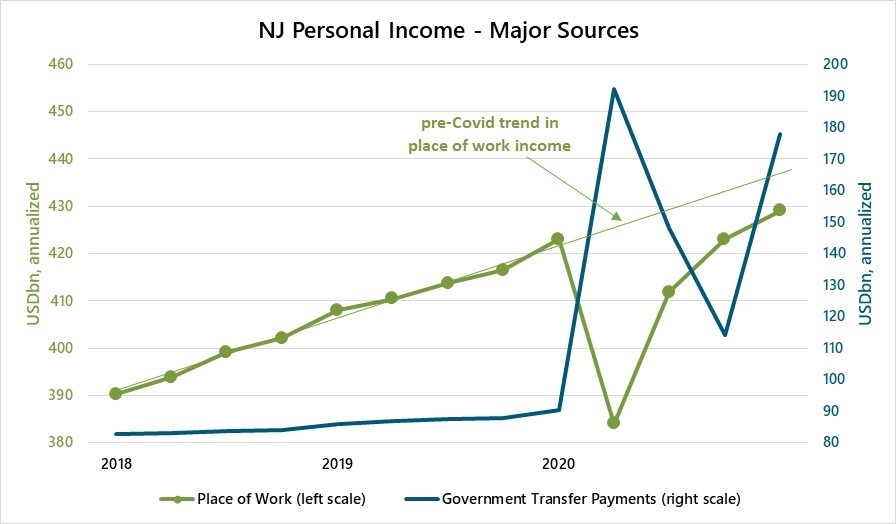
The following three charts demonstrate this outlook. Figure 1 shows the level of personal income in New Jersey. It has spiked in recent quarters, leading to a surge in consumer spending, as depicted in Figure 2. The reason for these spikes, as depicted in Figure 3, is largely about fiscal stimulus — money transferred from the federal government to households. As this chart shows, place of work income, which is income coming from jobs or business ownership, has rebounded smartly from its COVID low, but remains well below its pre-COVID trend. Federal government transfer payments – things like unemployment insurance and direct payments from the federal government to households (stimulus checks) – have spiked. Whereas government transfers to the New Jersey household sector averaged around $87 billion in 2019, they have averaged $158 billion in the four quarters through 2021:Q1. That’s an 11 percent jolt to the average New Jersey pre-tax income. In sum, COVID has been a boon to many households’ incomes.
Fig 1 – New Jersey Personal Income Through Q1 of 2021
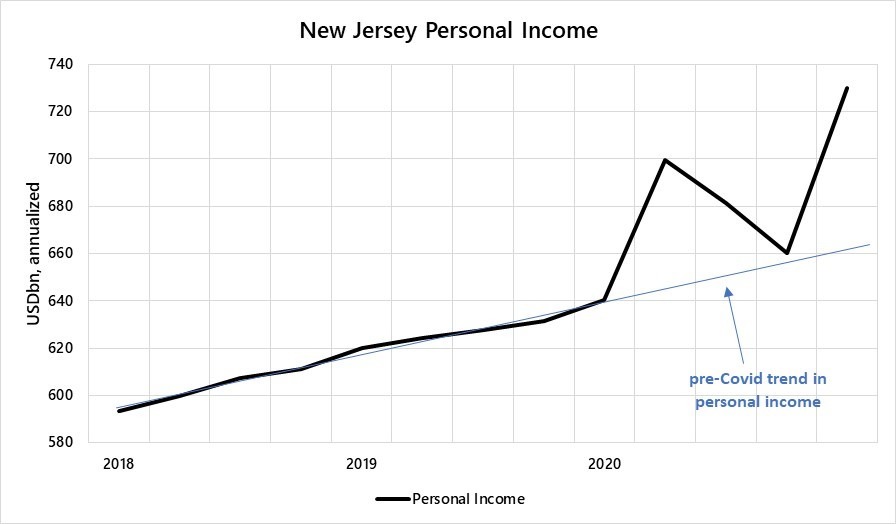
Fig 2 – Consumer Spending in New Jersey, by Zip Code Groups
s
Fig 3 – Major Sources of New Jersey Personal Income Through Q1 of 2021
Given these surges in stimulus-led NJ household income, it’s no wonder consumer spending and GDP have shot up, putting stress on supply. But fiscal surges like these do not make for a complete economic recovery. The reason why is easy to see: unless the surge in stimulus continues unabated or income rises to offset the drop in stimulus flow, demand will likely slow once the stimulus retracts. And one thing we know – the stimulus flow to households is now retracting as unemployment insurance benefits and stimulus payments to households are stopping.
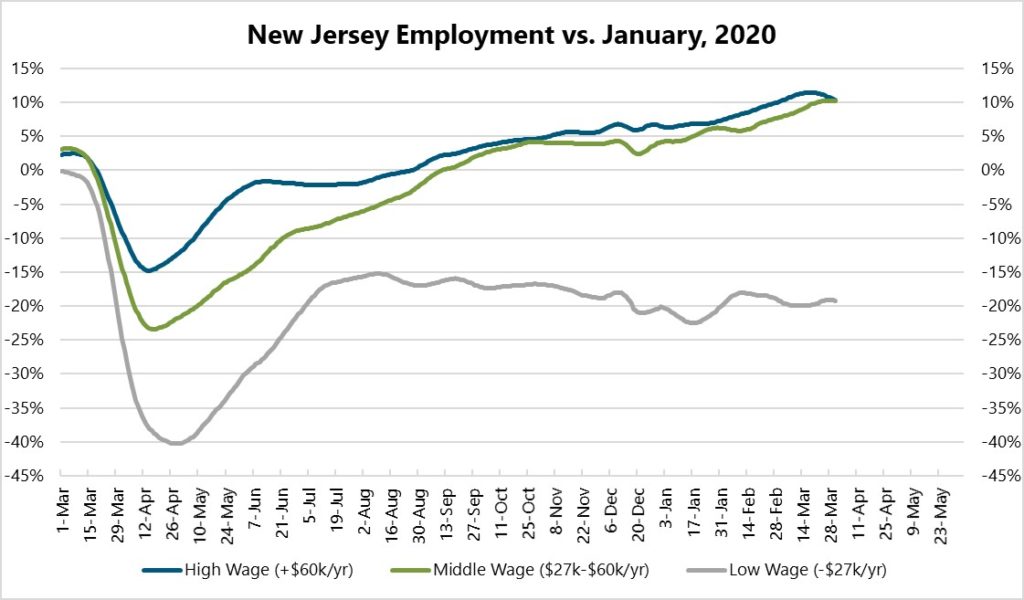
Although household income from place of work is rising, it remains below its pre-COVID trend. There are two reasons for weaker income level we’d like to highlight. One, as depicted in Figure 4, is the level of employment for low-wage jobs remains depressed. The ex-stimulus economy looks very tenuous for these workers.
Fig 4 – Employment in New Jersey by Wage Grouping
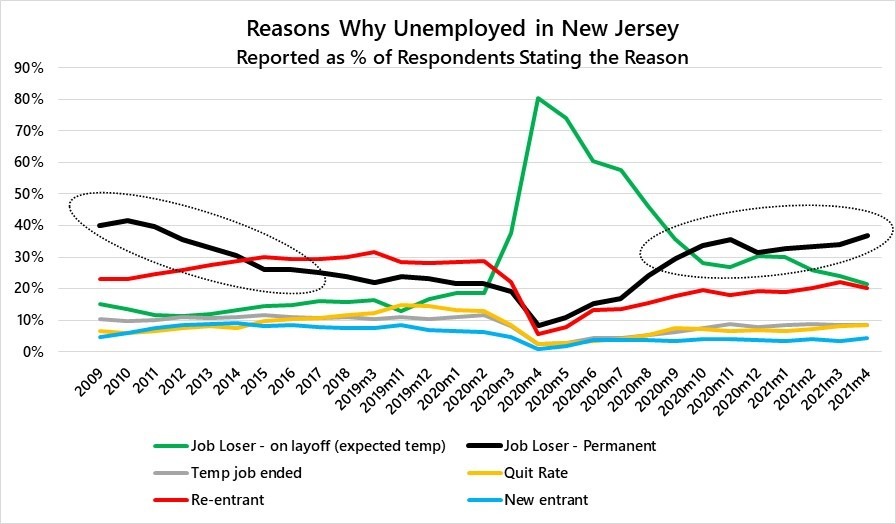
The other is, despite the jump in job openings signaling increased demand for labor, the level of layoffs remains relatively high. This is shown in Figure 5, which depicts microdata for New Jersey households detailing the reasons why people state they are unemployed.
There are a host of reasons a person would be classified as unemployed; it’s not just about being laid off from a job. Anyone who is not currently employed but is looking to be employed is considered unemployed. This includes new entrants into the labor market, such as a recent college grad or a person who had left the labor market and now is re-entering the market, and job quitters – people who chose to leave a job in search of a new one. Even job losses differ by whether they are the results of temporary layoffs or permanent layoffs. An example of a temporary layoff is a manufacturer who closes a factory for a month to re-tool that factory. The workers in that factory would be considered temporarily laid off and would likely reclaim their positions once the factory reopens.
A look at Figure 5 reveals a somewhat concerning trend – at a high and increasing rate, New Jersey residents cite permanent layoffs as the reason for being unemployed. This is unusual for an economic rebound. Normally, when the US economy is growing out of a recession, a rising share of unemployment is for re-entrants to the labor market and a falling share of unemployment is for permanent layoffs, as we can see in the period from 2010 through 2014. Although the re-entrant share is currently rising, it is doing so at a very slow clip. Meanwhile, the share of layoffs is still rising. This suggests net labor demand is not as strong as the standard press story would have us believe.
Fig 5 – Reasons for Being Unemployed
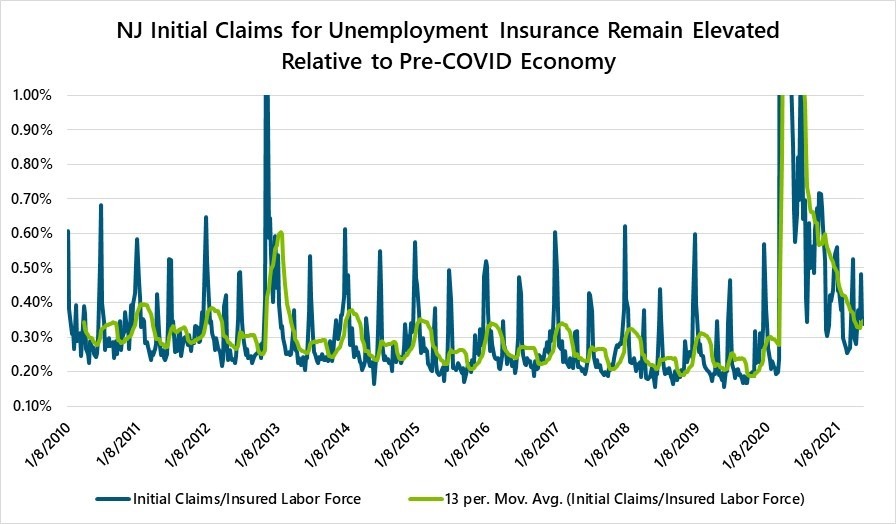
This picture of the labor market is further supported by the current level of initial claims for unemployment insurance. As shown in Figure 6, the level of claims remains around 1.5 times higher than it was pre-pandemic, which signals that, despite the surge in economic activity, the rate of layoffs remains elevated.
Fig 6 – Initial Claims for Unemployment Insurance Remain Elevated
In sum, despite the recent surge in economic activity and jump in job openings, the economic outlook for many households remains unclear. This is why New Jersey’s government continues to focus on policies that will provide support to households and small businesses and enable the state’s economy to keep growing as it continues to adjust to the COVID shock.
NJ Commercial Real Estate Update
Industrial CRE
The industrial market in New Jersey proved itself nearly invulnerable to the economic shock from COVID. In Northern New Jersey, Q3 of 2020 saw the highest quarterly net absorption figure in more than a decade,[1] and Southern New Jersey saw the highest leasing activity within the Philadelphia MSA over the past 12 months.[2]
At the beginning of 2020, statewide vacancy was an extremely low 3.7 percent, and during 2020, vacancy increased at most just 0.2 percent. Currently, the statewide vacancy rate rests at 3.6 percent.
Rents increased as well, indicating increased demand relative to limited supply for industrial space. In Q1 2020, overall triple-net average rent was $7.65 per sq. ft. By the end of 2020, it increased to $8.00 per sq. ft, and it currently stands at over $9 per sq. ft.
Significant Industrial Transactions: Q2 2020 – Q2 2021
Company Name | Industry | Location | Square Footage |
Amazon | Logistics | Carney’s Point | 1.25M sq. ft. |
UPS | Logistics | Bayonne | 880,000 sq. ft. |
FedEx | Logistics | Newark | 873,743 sq. ft. |
Elogistic | E-commerce Logistics | Mansfield | 710,368 sq. ft. |
PIM Brands (subsidiary of Promotion in Motion) | Candy warehousing and distribution | Somerset | 308,550 sq. ft. |
Misfits Market | Produce Delivery | Delanco | 245,000 sq. ft. |
Office CRE
The pandemic has not been kind to office markets across the world, and New Jersey is no exception. As seen in the graph below, vacancy increased to a level not seen since CoStar started tracking the market in New Jersey.
NJ Office Vacancy Rate
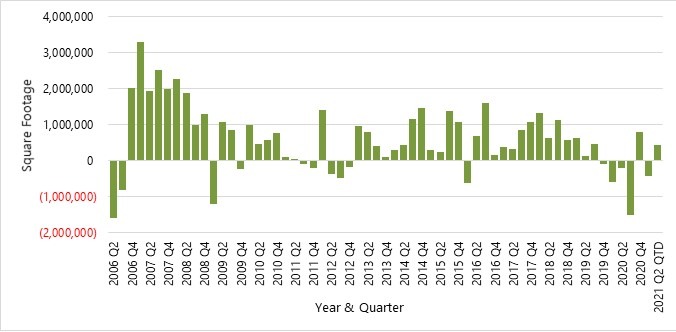
Net absorption[3] also saw a historic decline. Fourth quarter 2020 brought the lowest net absorption on record, and net absorption in every quarter from Q3 2020 to YTD 2021 has been sharply negative.
NJ Office Net Absorption
A rebound in the office sector will depend on a number of factors, such as vaccination rates and school re-openings. But the sector will have to contend with more companies allowing more work-from-home, which may cause a permanent contraction of office space leasing. However, a number of recent surveys indicate many employees are looking forward to being back in the office, which is good news for the sector in New Jersey. Most likely, many office tenants will adopt a hybrid work model that will dictate future square footage requirements for office tenants.
Significant Office Transactions: Q2 2020 – Q2 2021
Company Name | Industry | Location | Square Footage |
Eisai | Life Sciences | Clifton/Nutley | 332,818 sq. ft. |
Brother International Corp. | Electrical Equipment | Bridgewater | 101,724 sq. ft. |
Mallinckrodt | Pharmaceuticals | Hampton | 101,641 sq. ft. |
Wework/Organon | Wework- Coworking | Jersey City | 110,000 sq. ft. |
Lockheed Martin | Defense Industry | South Jersey (multiple locations) | 320,000 sq. ft. (four lease renewals) |
BAE Systems | Defense Industry | Mt. Laurel | 32,463 sq. ft. |
Retail CRE
Along with office, New Jersey’s retail market was certainly negatively impacted by the COVID pandemic. Net absorption for retail space statewide in Q3 2020 declined to the second lowest level ever in CoStar’s history. However, net absorption rebounded solidly in the fourth quarter of 2020, and CoStar’s analysts are forecasting net absorption will be positive starting in 2022 after seeing minimal negative absorption through 2021.
In addition, vacancy rates increased but perhaps not as drastically as initially feared. From Q2 2020 to now, statewide vacancy increased from around 4.3 percent to 5.3 percent. This reversed the trend of the previous two years, but the ills befalling retail establishments in New Jersey were not as drastic as those for office. This is likely due to people’s desire to continue visiting brick and mortar establishments, especially in light of increased vaccination rates, falling case rates, and the resultant elimination of state restrictions.
NJ Retail Net Absorption
NJ Retail Vacancy Rate

Significant Retail Transactions: Q2 2020 – Q2 2021
Company | Industry | Location | Square Footage |
AMC | Movie Theater | Elizabeth (Mills @ Jersey Gardens) | 220,016 sq. ft. (lease renewal) |
Total Wine | Liquor Store | Eatontown | 27,467 sq. ft. |
LA Fitness | Gym | Avenel | 38,000 sq. ft. |
Planet Fitness | Gym | Cherry Hill | 19,375 sq. ft. |
Goodwill | Nonprofit | Hazlet | 19,180 sq. ft. |
Harbor Freight Tool | Home & Garden Retail | Hazlet | 19,180 sq. ft. |
New Jersey’s International Trade Flows
With New Jersey’s economy moving closer to being fully re-opened, now is a good time to examine how international trade flows are faring in the aftermath of the COVID shock. At the beginning of the month, U.S.A Trade Online published trade figures through April, 2021, which marks one year from the lowest point of total exports during the pandemic when exports from New Jersey fell 29%.
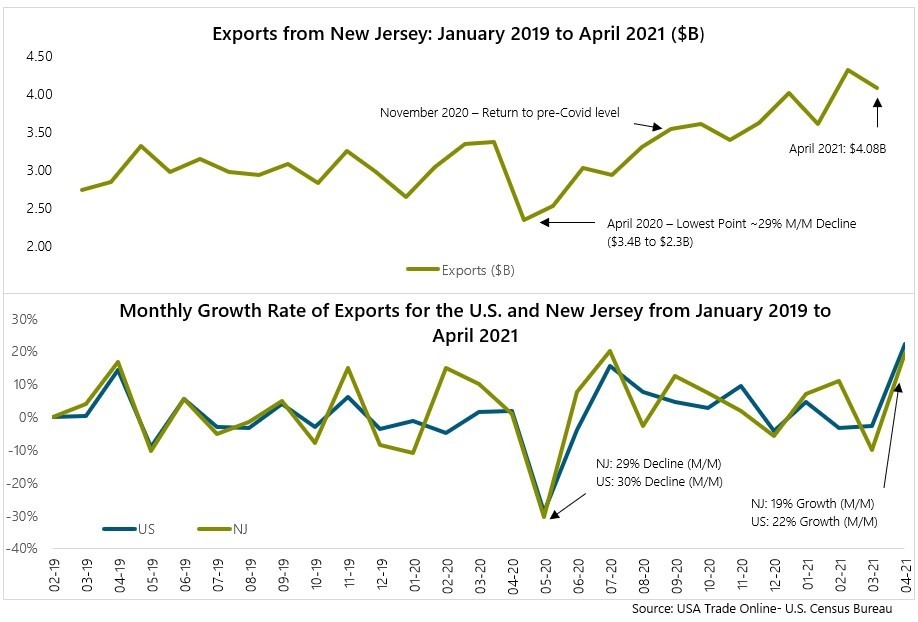
It wasn’t until November 2020 that exports returned to its previous value of $3.4 billion. Since that time, exports in New Jersey have been posting consistently strong growth, with an average monthly growth rate of 2.6 percent, which is considerably stronger than the 0.1 percent m/m rate in 2019.
In fact, Not only are we seeing a consistent increase in exports, but New Jersey is also outperforming the United States, which is averaging 1.9 percent m/m since November, 2020. Thus, New Jersey’s ranking has increased post-pandemic, from 14th largest exporting state in 2019 to 8th largest exporting state so far in 2021.
While there are still many uncertainties in the long run, the newest figures for trade prove to be optimistic for New Jersey’s future in the international landscape.
[1] CoStar_Northern New Jersey – NJ Industrial market report 2021
[2] CoStar_Philadelphia_Industrial Market Report
[3] Net Absorption: For existing buildings, the measure of total square feet occupied less the total space vacated over a given period of time.
Related Content
July 24, 2026
NJEDA Approves CAFE Program Awards for Projects in Westfield and Millburn
TRENTON, N.J. (July 24, 2026) – The New Jersey Economic Development Authority (NJEDA) Board approved two awards under the Cultural Arts Facilities Expansion (CAFE) Program, paving the way for projects at the Center for Creativity at the Rialto in Westfield and the Paper Mill Playhouse in Millburn.
July 23, 2026
Oncology Therapies Manufacturer Approved for NJEDA Next New Jersey Manufacturing Award
TRENTON, N.J. (July 23, 2026) – The New Jersey Economic Development Authority (NJEDA) Board approved a Next New Jersey Manufacturing Program award for Hopewell-based BeOne Medicines US Manufacturing Co., Inc.
July 23, 2026
NOTICE OF NJ MOTION PICTURE & TELEVISION COMMISSION ANNUAL BOARD MEETING
Please be advised that the New Jersey Motion Picture and Television Commission Annual Board Meeting will be held in person and via teleconference on Thursday, July 30, 2026, at 10:30 am.