Housing Market, Foreign Direct Investment, and GDP by County
Indicator 1 – NJ Housing Market – A Surge in Sales Leads Jump in Prices
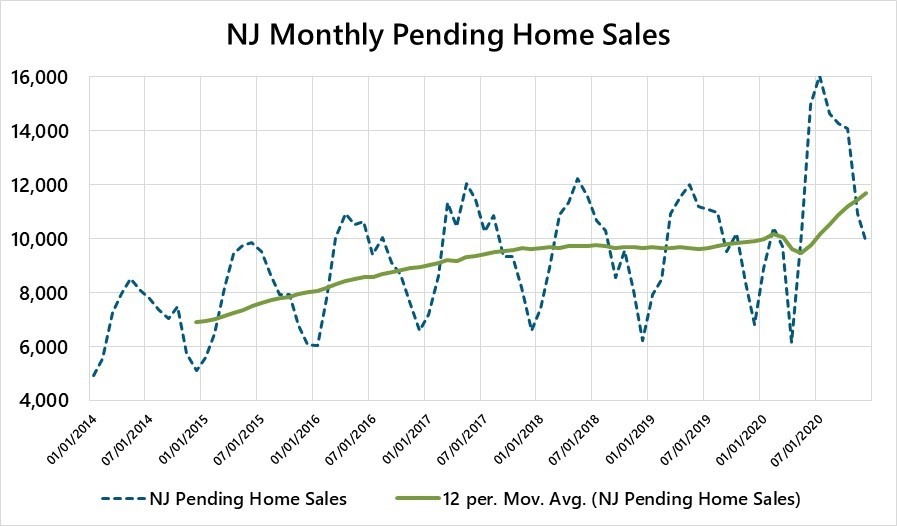
Source: New Jersey Association of Realtors (NJAR)
To an economist, housing is like any other market: it’s about supply and demand. And while demand for New Jersey homes has swelled, supply has done quite the opposite. And, as a result, prices have surged higher.
Pending sales is the best leading indicator of housing demand. Pending sales track home sale contract signings, which generally occur one to two months before the sale is officially recorded. Pending home sales surged during the second half of 2020, up approximately 40 percent compared to 2019.
Why has demand surged? The sharp drop in mortgage rates, which increased buying power in the housing market, is a probable factor. But there were also some clear behavioral changes produced by COVID-19, including more households relocating from nearby urban areas into New Jersey.
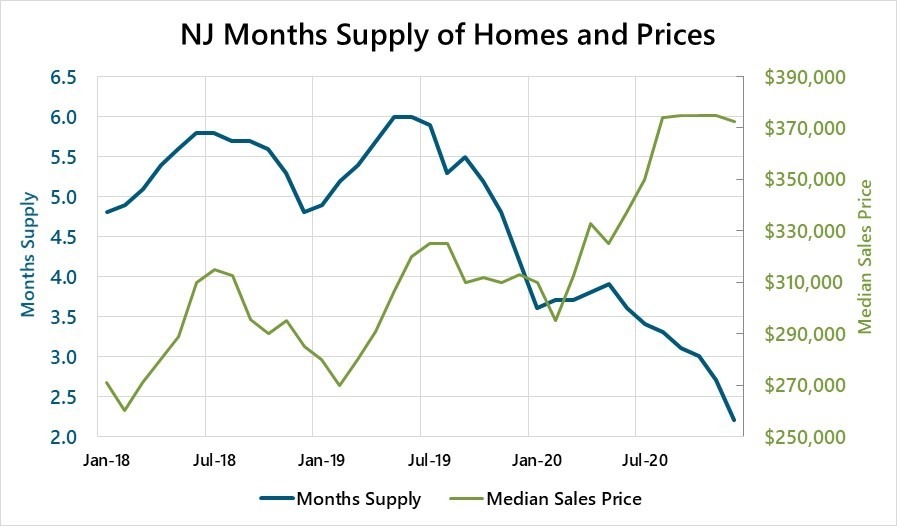
With increasing demand and no commensurate rise in supply, house prices increased a lot. According to the New Jersey Association of Realtors (NJAR), the median sale price in 2020Q4 was around $375,000, up 20 percent from approximately $310,000 in 2019Q4. It is important to note that this data only reflects the prices of homes that were sold, meaning the value of all homes may not have increased that much. However, the data shows median prices rose across all New Jersey counties, suggesting there has been an actual increase in home prices.
It is possible these price increases will encourage more people to sell their homes because prices are signals to the market. We saw an example of this early in the pandemic, when increased demand for masks drove up the price and many clothing companies began producing their own cloth facemasks. In the housing market, a rise in prices clearing the market might induce someone who was not otherwise thinking of selling their house – someone on the “margin” — to put it up for sale.
But what if homeowners now value their homes more highly than they did before? In that case, the rise in prices might not induce many more people to put their homes up for sale because the price hasn’t risen enough. In essence, the margin has shifted. One can make a good argument that this is exactly what is happening now in New Jersey, as the supply of homes for sale remains exceptionally low relative to demand. A good indicator of the balance between supply and demand is depicted in the chart on the right, which shows Months Supply of Inventory (MSI), which indicates of how many months it would take to clear all supply given the current pace of home sales. In December, new listings in 2020 were down 8.6 percent versus 2019, and the MSI of homes was at an all-time low of 2.2. This suggests prices might need to increase even more before we will see more homes put up for sale.
Of course, there is another obvious way to increase the housing supply: building more homes! It is certainly conceivable the rise in prices will induce home builders to produce more homes, and in recent months there has been a jump in the level of housing building permits issued.
In sum, demand for housing remains strong even as home prices have risen significantly. In order for the demand jump to induce a supply response, prices will have to rise more than they already have. At some point, construction of new homes will likely help fill that gap.
Indicator 2 – Estimated Jobs Created in NJ by Greenfield Foreign Direct Investment
Throughout 2020, nearly every aspect of the international markets took a hit, and Foreign Direct Investment (FDI) was no exception. With so much uncertainty surrounding a post-pandemic economy, it was clear the pace of FDI would slip. Still, many foreign companies announced Greenfield[1] Projects in New Jersey throughout 2020.
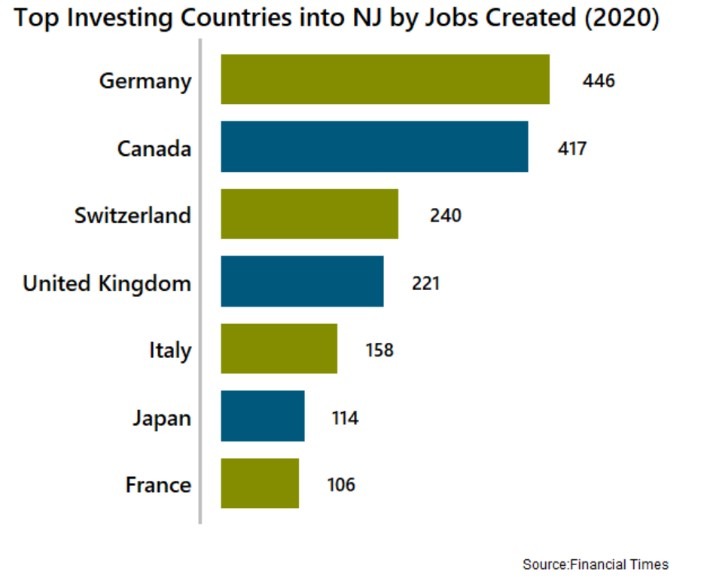
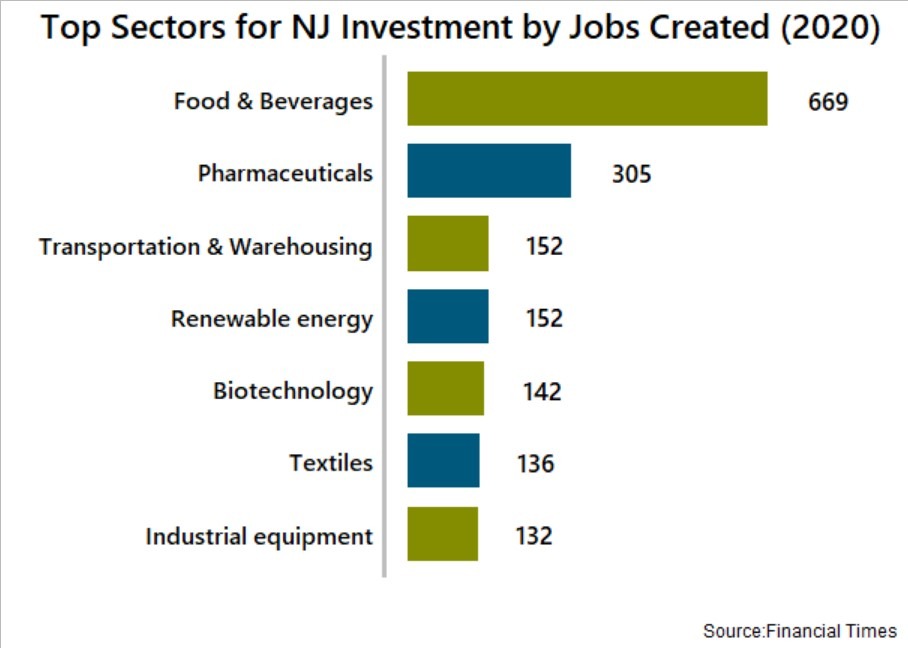
According to fDi Markets, foreign investors in 2020 announced 32 projects in New Jersey, which will result in an estimated $1.5 billion in capital expenditures and an estimated 2,120 jobs. A total of 15 countries announced New Jersey projects in 2020, with Canada and the United Kingdom tying for most projects created at six, and Germany topping the rankings for most jobs at an estimated 446. Many of Germany’s projects were in the food & beverage sector, which makes up a considerable portion of jobs created. This amount of jobs stemming from retail indicates many international organizations are confident enough in New Jersey’s broad consumer market to keep expanding brick and mortar stores in the face of a pandemic.
Investments went into a variety of sectors, including pharmaceuticals, renewable energy, and biotechnology. One of the largest investing companies for 2020 announced two solar plants in Woodbine and another in South Brunswick, resulting in an estimated $643 million in capital expenditures. These investment projects show a definitive sign that many international organizations see New Jersey as a go-to hub for commercial and consumer investment, even during times of global economic and public health uncertainty.
Indicator 3 – Gross Domestic Product by County
The Bureau of Economic Analysis releases figures on Gross Domestic Product (GDP) by county every year. Most recently, data was released for 2019. Following is a brief analysis of county GDP in New Jersey from 2006 – 2019 focused on real GDP, which is adjusted for inflation.
The largest industry statewide and in many counties in 2019 was finance, insurance, and real estate (20 percent statewide). Other industries topping the list in individual counties included professional and business services (18 percent), manufacturing (9 percent), and government (10 percent). As can be seen in Table 1, a majority of the largest industries in 2006 remained the largest contributors to county GDP in 2019. In addition, for the counties where the largest industry remained the same from 2006-2019, those industries saw minimal change in their contribution to county GDP. One exception was Hudson County, which saw a 10 percentage point drop in the share of GDP contributed by finance, insurance, and real estate. This drop was filled by a nine percentage point increase in professional and business services – an industry group that thrived in Hudson County.
Table 2 reports the industries that grew the most in New Jersey’s counties between 2006 and 2019 for which the industry accounts for at least two percent of the county’s GDP. Fastest statewide growth rates were recorded by information and professional and business services. Overall, there was a wide array of industries posting strong growth rates, including transportation and warehousing, utilities, educational services, health care, and social assistance. Some of NJ’s counties did see dramatic growth in industries such as Agriculture, Forestry, Fishing, and Hunting and also Mining, Quarrying, and Oil and Gas extraction. However, generally those industries make up a very small contribution to county GDP across the state and therefore are not included in the below table.
Table 1: Largest Major Industry Share of GDP
NJ County | 2006 Largest Industry Share | 2019 Largest Industry Share |
Statewide | Finance, Insurance, Real estate (23%) | Finance, Insurance, Real estate (20%) |
Atlantic | Arts, entertainment, recreation, accommodation, and food services (31%) | Finance, Insurance, Real estate (20%) |
Bergen | Finance, Insurance, Real estate (21%) | Finance, Insurance, Real estate (17%) |
Burlington | Finance, Insurance, Real estate (25%) | Finance, Insurance, Real estate (21%) |
Camden | Finance, Insurance, Real estate (23%) | Finance, Insurance, Real estate (21%) |
Cape May | Finance, Insurance, Real estate (36%) | Finance, Insurance, Real estate (37%) |
Cumberland | Government (20%) | Government (18%) |
Essex | Finance, Insurance, Real estate (26%) | Finance, Insurance, Real estate (24%) |
Gloucester | Manufacturing (22%) | Manufacturing (21%) |
Hudson | Finance, Insurance, Real estate (43%) | Finance, Insurance, Real estate (33%) |
Hunterdon | Professional & Business Services (20%) | Finance, Insurance, Real estate (23%) |
Mercer | Finance, Insurance, Real estate (20%) | Professional & Business Services (22%) |
Middlesex | Finance, Insurance, Real estate (20%) | Professional & Business Services (22%) |
Monmouth | Finance, Insurance, Real estate (22%) | Finance, Insurance, Real estate (20%) |
Morris | Finance, Insurance, Real estate (21%) | Professional & Business Services (30%) |
Ocean | Finance, Insurance, Real estate (27%) | Finance, Insurance, Real estate (25%) |
Passaic | Finance, Insurance, Real estate (23%) | Finance, Insurance, Real estate (21%) |
Salem | Utilities (49%) | Utilities (54%) |
Somerset | Manufacturing (24%) | Professional & Business Services (25%) |
Sussex | Finance, Insurance, Real estate (23%) | Finance, Insurance, Real estate (23%) |
Union | Manufacturing (21%) | Manufacturing (19%) |
Warren | Manufacturing (27%) | Finance, Insurance, Real estate (19%) |
Table 2: Industry Growth for industries at least 2% of regional GDP (state & county)
Area | Most Growth (Percent growth between 2006-2019) | 2nd Most Growth (Percent growth between 2006-2019) |
New Jersey | Information (46%) | Professional & Business Services (42%) |
Atlantic | Professional & Business Services (31%) | Educational services, health care, and social assistance (25%) |
Bergen | Information (38%) | Educational services, health care, and social assistance (29%) |
Burlington | Information (168%) | Educational services, health care, and social assistance (48%) |
Camden | Arts, entertainment, recreation, accommodation, and food services (31.5%) | Educational services, health care, and social assistance (31%) |
Cape May | Manufacturing (96%) | Wholesale Trade (27%) |
Cumberland | Agriculture, forestry, fishing and hunting (68%) | Wholesale Trade (40%) |
Essex | Utilities (129%) | Transportation & Warehousing (48%) |
Gloucester | Utilities (155%) | Transportation & Warehousing (99%) |
Hudson | Professional & Business Services (140%) | Information (112%) |
Hunterdon | Information (105%) | Educational services, health care, and social assistance (27%) |
Mercer | Transportation & Warehousing (107%) | Wholesale Trade (82%) |
Middlesex | Utilities (267%) | Transportation & Warehousing (60%) |
Monmouth | Information (41%) | Educational services, health care, and social assistance (37%) |
Morris | Professional & Business Services (75%) | Educational services, health care, and social assistance (42%) |
Ocean | Professional & Business Services (64%) | Educational services, health care, and social assistance (30%) |
Passaic | Educational services, health care, and social assistance (22%) | NA |
Salem | Transportation & Warehousing (73%) | Educational services, health care, and social assistance (6%) |
Somerset | Information (85%) | Professional & Business Services (57%) |
Sussex | Manufacturing (107%) | Transportation & Warehousing (5%) |
Union | Utilities (48%) | Professional & Business Services (38%) |
Warren | Professional & Business Services (126.3%) | Information (16%) |
[1] Greenfield FDI is an investment that occurs when a foreign company invests in a brand-new foreign project, versus something like M&A.
Related Content
July 24, 2026
NJEDA Approves CAFE Program Awards for Projects in Westfield and Millburn
TRENTON, N.J. (July 24, 2026) – The New Jersey Economic Development Authority (NJEDA) Board approved two awards under the Cultural Arts Facilities Expansion (CAFE) Program, paving the way for projects at the Center for Creativity at the Rialto in Westfield and the Paper Mill Playhouse in Millburn.
July 23, 2026
Oncology Therapies Manufacturer Approved for NJEDA Next New Jersey Manufacturing Award
TRENTON, N.J. (July 23, 2026) – The New Jersey Economic Development Authority (NJEDA) Board approved a Next New Jersey Manufacturing Program award for Hopewell-based BeOne Medicines US Manufacturing Co., Inc.
July 23, 2026
NOTICE OF NJ MOTION PICTURE & TELEVISION COMMISSION ANNUAL BOARD MEETING
Please be advised that the New Jersey Motion Picture and Television Commission Annual Board Meeting will be held in person and via teleconference on Thursday, July 30, 2026, at 10:30 am.